Strong El Nino Impacts for Winter in the Mid-South


Wednesday September 9, 2015 Update:


Created by Jennifer Rukavina via NOAA/ESRL Data
The current trend will continue as NOAA continues to forecast a strong El Nino episode through late Winter and possibly Spring 2016. The following two graphics show on a map what I have detailed below about "Notable El Nino Episodes for Winter". Winters tend to be warmer than normal and precipitation stays fairly average. The two maps compare the previously mentioned winter El Nino episodes to the long-term average from 1950-2007.


Created by Jennifer Rukavina via NOAA/ESRL Data


August 21, 2015 Original Post

Forecasting into the season ahead is most accurate when looking to similar weather patterns of the past. As you have probably seen in the news El Nino is expected to strengthen into the upcoming fall and winter. I've done a little digging into the historical record to find out how we have fared during similar El Nino episodes. Here is what I was able to find...


Meteorologists look at monthly data from Dec - Jan - Feb to determine a winter season average, or define that period of time as Meteorological Winter. A winter in the Local 6 area shows an average temperature of 37 degrees, average precipitation total of 12.18" and average snowfall of 8.4".

The National Weather Service in Paducah has historical data that covers 5 of the past strongest or similar El Nino episodes in the past 75 years (according to current forecast trends).
(Click to Enlarge - Credit Jennifer Rukavina &
Paducah National Weather Service climate records)
The similar El Nino episodes include the winters of 1957-19581965-1966, 1972-1973, 1982-1983, and 1997-1998. In each episode, temperatures averaged close to or above normal. In these 5 cases, the stronger the El Nino episode, the warmer the winter averaged. 1997-1998 was a record strong episode and temperatures averaged about 4 degrees warmer for the season. For the entire central region, (IL, IN, OH, WV, KY, TN, MO) it still holds the record for 2nd warmest winter.

Moving on to precipitation. Most of the cases averaged close to normal for the season with the exception of winter 1982-1983. I believe this to be an exceptional case since on one single day, (Dec 3) a record 4.65" of rain was recorded. If we exclude that one single day, 1982-1983 would also calculate close to average. In the central region precipitation ranked 35th driest during the record El Nino episode of 1997-1998.
It is a completely different scenario for snow totals. As the El Nino events in this post gained strength, the average snowfall dropped significantly. Winter 1965-1966 was the only season that came close to the average with 5".
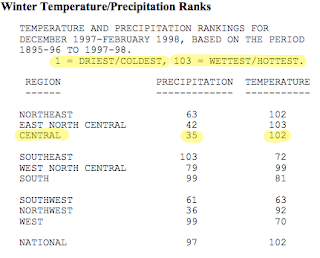
(NCDC - El Nino of 1997-1998)

Simply put....warmer El Nino winters tend to bring less snow to the Local 6 area but do not leave us short-changed in precipitation. If the predicted El Nino episode ahead materializes as predicted by NOAA, we could be looking at a much warmer winter than last year and continue strong with our wet weather pattern.
As a personal forecaster's disclaimer.....remember it only takes ONE snow event to make a big impact. In most of the winter cases from the past, we had quite a few TRACE snow days, just not accumulating. Use this information as guidance and for planning but we all know weather/climate in the Mid-South is anything but certain. :)


Comments

Unknown said…
I think she's right y'all
Unknown said…
Very informative. Wow. Thanks for posting. Loved the time line.
Unknown said…
Very informative. Wow. Thanks for posting. Loved the time line.

Popular posts from this blog

Mid-South Winter Outlook 2023-2024

Getting a general idea of what the upcoming Winter months (December, January and February) will look like for our region can be heavily influenced by El Nino and La Nina episodes. Global and oceanic forecasters have observed El Nino conditions in the central and eastern Pacific Ocean and an EL NINO ADVISORY has been issued. The episode is expected to continue through Spring (March, April and May) in the Northern Hemisphere. Model projections are pointing to a strong, possibly very strong episode occurrence.  (Current Sea Surface Temps warming off S. America) Meteorologists look at monthly data from Dec - Jan - Feb to determine a winter season average, or define that period of time as Meteorological Winter. An average winter in the Local 6 area shows an average temperature of 37 degrees, average precipitation total of 12.18" and average snowfall of 8.4". The National Weather Service in Paducah has historical data that covers 7 of the past strongest El Nino episodes in the past

Planting Zones Heading North

As our global climate changes, so does our planting zones, helping us determine which flowers/shrubs/trees are hardy in specific areas. The Local 6 area has always been split by 2-3 growing zones so placement becomes very important to those in the agricultural community. The image below represents the average over the past 30 years. Climate Central published the following information:  "What kinds of flowers, shrubs and trees you’ll find at your local nursery depends on your climate — how warm it tends to get in summer, and how cold in winter. A plant that’s happy in Wisconsin might be miserable in Alabama, and vice versa. The U.S. Department of Agriculture has formalized these differences into " hardiness zones " — strips of similar climate that run more or less east-to-west (except in the high mountains), where particular plants should do especially well. But as the planet warms under its thickening blanket of greenhouse gases, those zones are shifting northward. Th

Update: Impacts From Tropical Depression Bill

Friday AM Update Heavy rain still appears to be our greatest concern as the remnants of Tropical Storm Bill pass directly over the Local 6 area throughout the day today. A Flash Flood WATCH continues for Southern Illinois, SE Missouri, and the Ohio River counties in Western Kentucky through Saturday. Here is a look at today's forecast concerning rainfall totals from the Weather/Hydrological Prediction Center. In any given area, 2-4 inches of rain will be possible. Low-lying areas are most prone to flash flooding. Showers and storms will increase in coverage and intensity during the day on Friday.  Keep preparedness and awareness in mind as heavy rain moves in. Locate areas of higher ground in the event you need to retreat there. Never drive across flooded roadways. Keep children from playing in flood waters. Water depth and swiftness is difficult to determine. Below is the latest Flash Flooding Potential Briefing from the Paducah National Weather Service.